Portfolio · 2026 London, UK Open to graduate roles

Nikunj Prajapati

Data analytics postgraduate building leakage-clean clinical and behavioural models.

I predict heart-failure outcomes on real patient data, analyse how people organise information under pressure, and report the numbers that survive the audit — higher ones included only when they deserve to be.

0

Heart-failure patients

HF-RISK cohort, Zhang / PhysioNet

0

AUROC at 6 months

After the leakage audit

0

MIMIC-IV admissions

External transport check

0

Card-sorting trials

714 usable after cleaning

The record

What I've actually done.

Education on one side, results on the other — no adjectives required.

Education & credentials

  • Jul 2026 MSc Data Analytics London Metropolitan University

    Dissertation: HF-RISK — heart-failure outcome prediction with a full leakage audit, a MIMIC-IV GCS extension and a Streamlit prototype.

  • Jun 2021 B.Sc. Mathematics Gujarat University

    Where the modelling instincts started.

  • Apr 2023 Bachelor of Education Gujarat University

    A separate degree, not a second B.Sc. — the explaining half.

Community volunteer · Metropolitan Police Safer Neighbourhoods (Aug 2025).

Selected achievements

  1. 0.819 → 0.710

    Cut a heart-failure model down to the honest number

    An early pass hit 0.819 AUROC at six months. The leakage audit removed features that only exist after the outcome, and I reported the 0.710 that survived.

  2. MIMIC-IV

    Tested transportability instead of claiming it

    Transferred the same pipeline to 42,990 MIMIC-IV admissions with no retraining — 0.599 AUROC, presented as a domain-shift check, not a clinical result.

  3. 845 trials

    Turned messy behavioural logs into a readable signal

    Cleaned 845 recorded card-sorting trials down to 714 usable ones and shipped a nine-view interactive explorer with move-by-move retry tracing.

  4. 28-day · 3-month

    Found where the simpler model wins

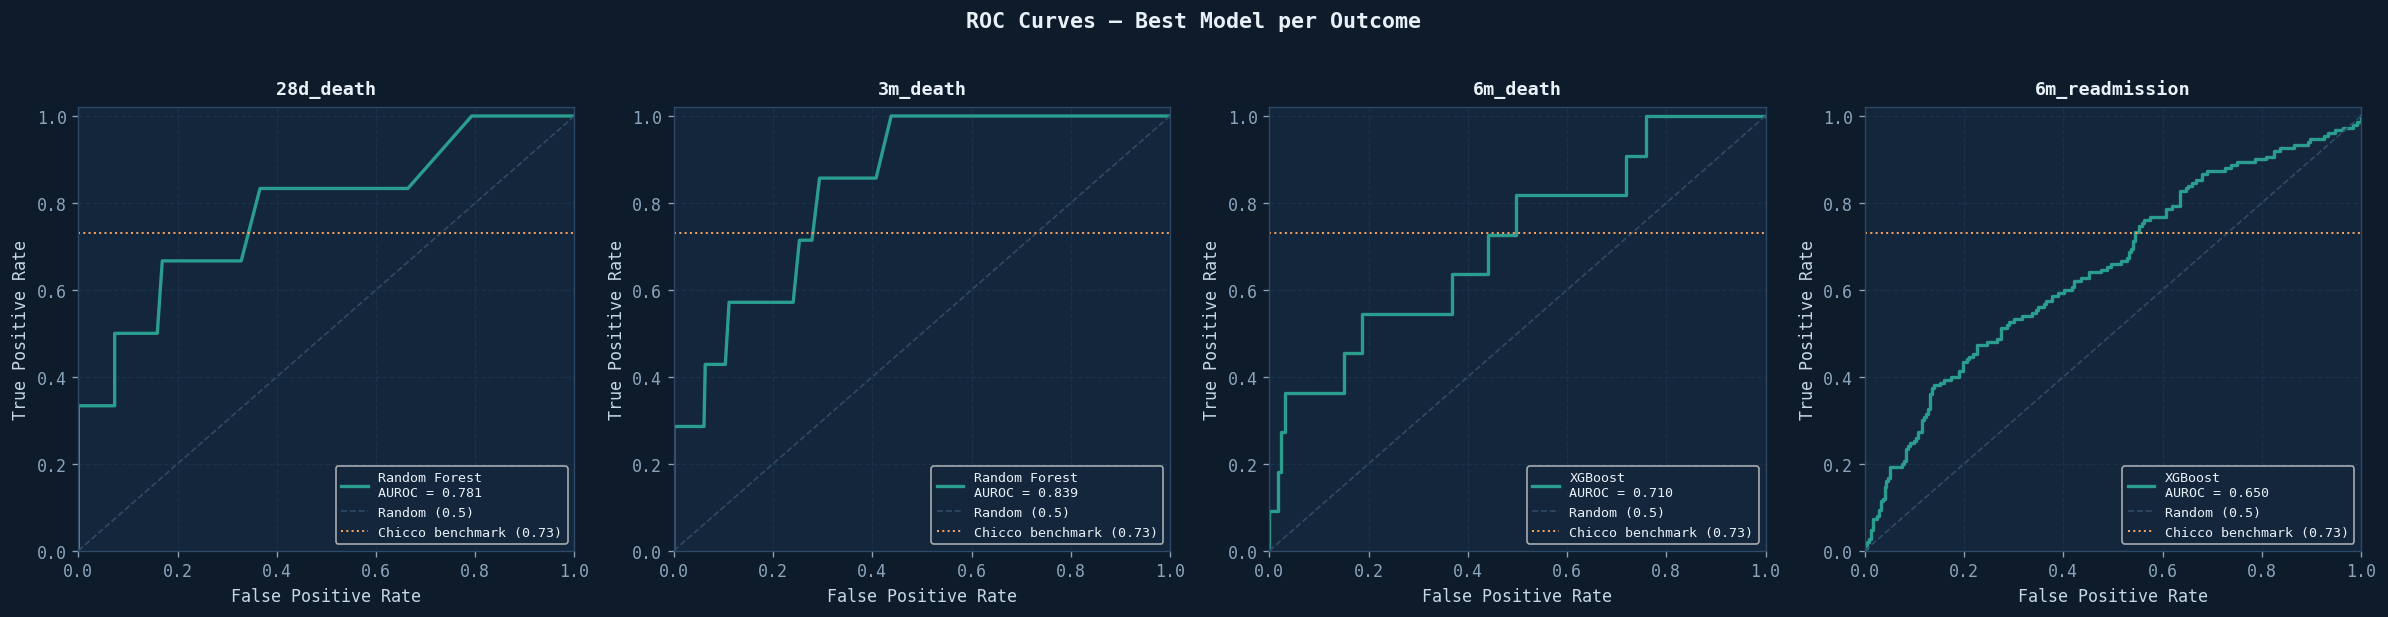
    Random Forest took the short horizons — 0.781 and 0.839 AUROC — while XGBoost led at six months. Benchmarks include baselines, not just the winner.

  5. TMX China

    Calibrated AI responses against a quality rubric

    Scored and calibrated LLM output, then fed systematic failure patterns back to the model team as a structured feedback loop.

  6. Ladbrokes / Entain

    Lead a floor while studying full-time

    Customer Service Manager: shift rota, escalations and coaching under Gala Coral Group brand standards — compliance-adjacent work where the data has to be right.

Featured work

Two projects, one standard.

Both finished, both documented end to end — including the parts that didn't work.

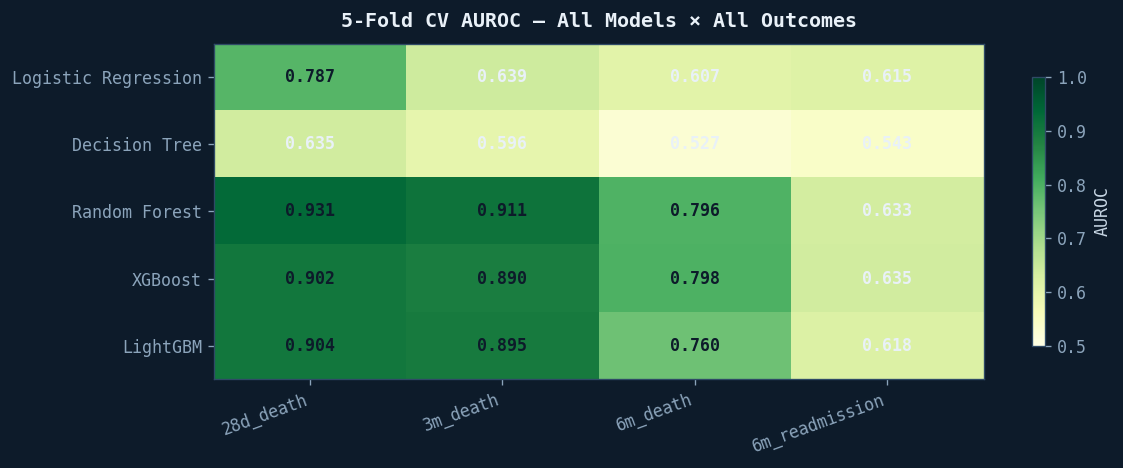
AUROC heatmap comparing five heart-failure models across four outcome horizons after the leakage audit
  • ROC curves for the held-out heart-failure cohort across four horizons
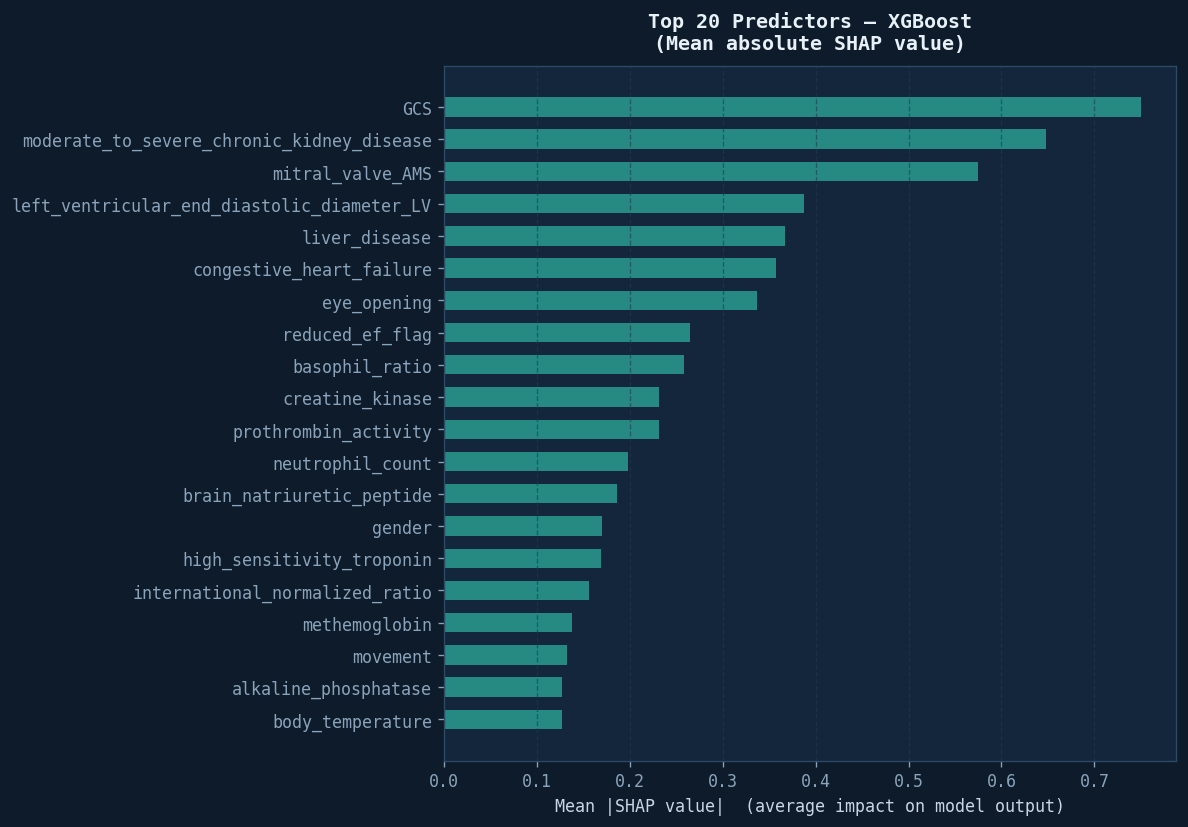
  • SHAP bar chart of global feature importance for the heart-failure model
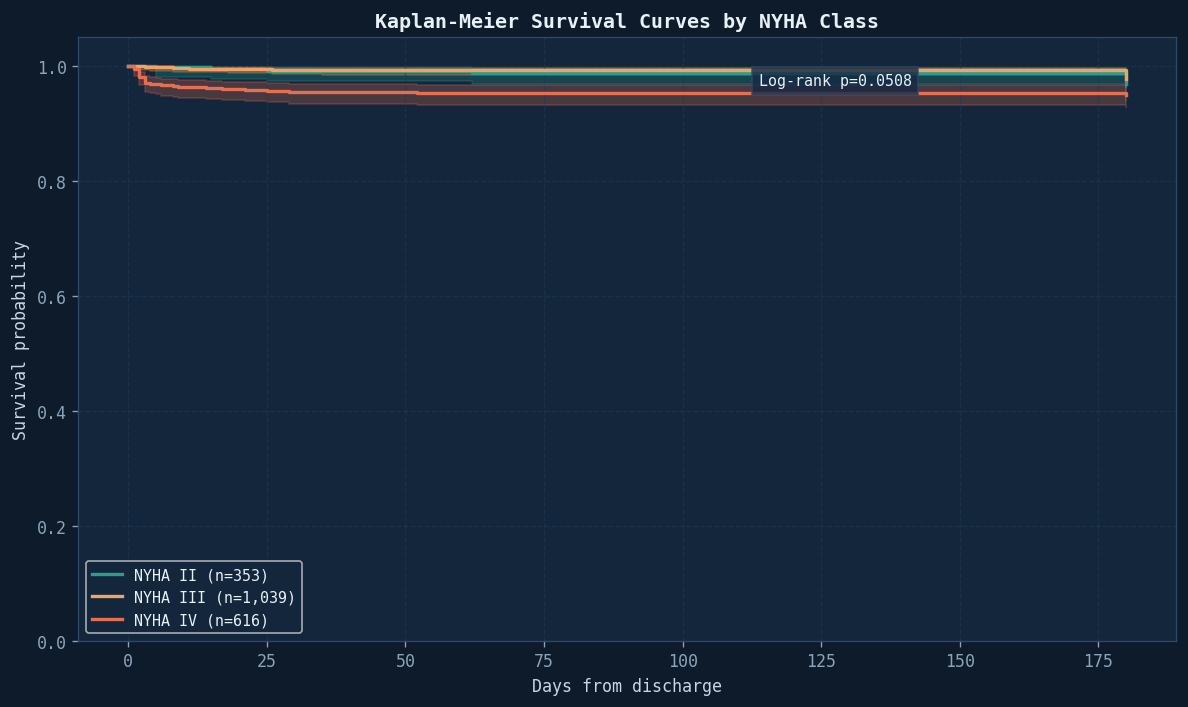
  • Kaplan-Meier survival curves split by NYHA heart-failure class

Heart-failure ML · MSc Dissertation · 2026

HF-RISK — Predicting Heart Failure Outcomes with Machine Learning

Five models, four outcome horizons, 2,008 patients — and a leakage audit that cut the headline AUROC from 0.819 to 0.710 before I believed a single digit of it. Then a patient-grouped retrain inside MIMIC-IV tested the GCS signal properly.

Primary result
0.710 AUROC · 6-month mortality
Short horizons
0.781 / 0.839 AUROC
GCS extension
+0.0138 AUROC · MIMIC-IV
External set
42,990 MIMIC-IV admissions
  • Python
  • XGBoost
  • Random Forest
  • SHAP
  • MIMIC-IV
  • Survival analysis
Read the case study
6 5 2 8 4 3 7 A 8 5 7 4 3 6 2 2 5 8 7 4 3 A 6 2 8 4 6 5 A 3 7 2 3 4 A 6 5 7 8 3 4 7 A 2 5 8 6 2 5 4 A 7 6 3 2 3 6 A 8 7 5 4

As given — scattered

A 2 3 4 5 6 7 8 A 2 3 4 5 6 7 8 A 2 3 4 5 6 7 8 A 3 4 5 6 7 8 A 2 3 4 5 6 7 8 A 2 3 4 5 6 7 8 A 2 3 4 5 6 8 A 2 3 4 5 6 7 8

Organised — runs + blank scaffolding

Behavioural psychology · London Met · 2026

Interactive Card Sorting — Spatial Organization & Cognitive Strategy

Given playing cards — and sometimes blanks — on an 8×8 board, how do people organise what matters? 845 recorded trials show that organisation beats raw effort, and blank cards act as scaffolding.

Trials recorded
845 · 714 usable
Analysis views
9 interactive modes
Key finding
Organisation > time on task
Blank cards
Used as scaffolding
  • Python
  • Behavioural analysis
  • Plotly
  • Interactive viewer
Open the card lab

Explore

Everything else, one click away.

If you only read the homepage, this is the map. The detail lives one tap further in.

Capabilities

What I actually do.

Four moves, repeated carefully: model, clean, explain, report.

  1. Predictive modelling

    Regression, survival models and tree ensembles — benchmarked against baselines, never picked by vibes.

  2. Data quality

    Missingness audits, leakage hunting and feature hygiene before any model gets to see the data.

  3. Explainability

    SHAP-driven feature reduction and calibration checks, so a stakeholder can see why the model says what it says.

  4. Reporting

    Reports and dashboards that separate signal from confidence theatre, and name their own limits.

01

Integrity before performance

A high AUROC built on leaked features is a liability, not an achievement.

02

Explainability is the deliverable

A model nobody can question is a model nobody can trust.

03

Small is honest

With 2,008 patients or 845 trials, I report what the data supports — and say so when that is the limit.

Questions

The things people ask first.

Short answers to the questions that come up most — on the heart-failure model, the card-sorting study, and what I'm looking for next.

What is HF-RISK?

HF-RISK is my MSc dissertation project: a machine-learning model that predicts heart-failure outcomes — 28-day, 3-month and 6-month mortality plus 6-month readmission — across 2,008 patient records from the Zhang / PhysioNet heart-failure cohort. Five model families were benchmarked and the final pipeline carries 143 audited predictors, with SHAP used to explain what the model learned. It was later extended with a patient-grouped retrain inside MIMIC-IV.

What did the Glasgow Coma Scale extension find?

GCS components — eye opening, verbal response and movement — added a small, consistent AUROC gain when I retrained inside MIMIC-IV: +0.0138 at 28 days (95% CI 0.0090 to 0.0194) and +0.0086 at six months, on a grouped split where no patient appears in both training and test. The control mattered more than the headline: an independent ICU-stay flag alone was a null result at six months (+0.0014), yet GCS still added +0.0104 on top of it — so the gain is not simply “this patient was sick enough for intensive care”. GCS was left missing for the 72% of admissions where it was never charted, rather than imputed as a normal score.

How did you stop the heart-failure model from cheating?

A leakage audit. My first pass scored 0.819 AUROC at six months, but features such as day of discharge and inpatient record numbers are only written after the outcome is already decided. Removing them dropped the honest result to 0.710 — a lower number that actually means something, and the one I published.

What is the card sorting project about?

It is a behavioural psychology study of spatial organisation and cognitive strategy. Participants arranged playing cards — including blank cards — on an 8×8 board, and I analysed 845 recorded trials (714 usable) to see how people organise what matters while solving a task.

What did the card sorting analysis find?

Organisation beat raw effort. How a board was arranged predicted completion better than how long someone spent on it, and blank cards worked as scaffolding — markers that made structure easier to hold on to. The interactive viewer traces all nine analysis views, including move-by-move replay of individual trials.

Can the HF-RISK model be used clinically?

No. It is a research prototype, not a clinical tool. The numbers describe one 2021 cohort plus a single transportability check against 42,990 MIMIC-IV admissions, where AUROC was 0.599 without retraining. It is deliberately framed as research-only.

What tools and methods do you use?

Python — pandas, NumPy, scikit-learn, XGBoost, lifelines, SHAP, Plotly and Streamlit — plus SQL, R and JavaScript for the viewer work. The method matters more than the library: leakage auditing, calibration, subgroup checks and honest reporting of failure modes.

Are you available for work?

Yes. I am based in London and available now for graduate data analyst, data science and analytics engineering roles. The fastest way to reach me is the contact form on this page, or by email at prajapatinick85@gmail.com.

Contact

Let's build something insightful.

Graduate roles, data projects or a question about either case study — send a message and I'll reply within 48 hours.

Elsewhere
  • GitHub
  • LinkedIn